Evaluate (v) – to determine the significance, worth, or condition of usually by careful appraisal and study (Merriam-Webster).
Evaluating is a fundamental 21st Century skill and according to P21.org in order “to be effective in the 21st century, citizens and workers must be able to create, evaluate, and effectively utilize information, media, and technology.” This is coupled with the need of all historians and social studies students to be able to evaluate evidence and ideas in order to draw conclusions on the past to make connections and better decisions for the future. Therefore, evaluating is a skill my students see throughout the year and a word they become very familiar with in my class.
I find that for my middle school students using Google Drawings allows them to visualize the conclusions of their evaluations. At times students need to evaluate on an ordered scale, ranking ideas or information based on different degrees of significance. For example, ranking the significance of the most influential people of the Renaissance. There are also instances when students need to determine a set conclusion based on their evaluations. For example, is this a reliable source for my research paper. I find that Google Drawings gives students the ability to create a concrete visual representation of these different conclusions. Here are a few examples of how to use Google Drawings to evaluate.
Impact Line Graph
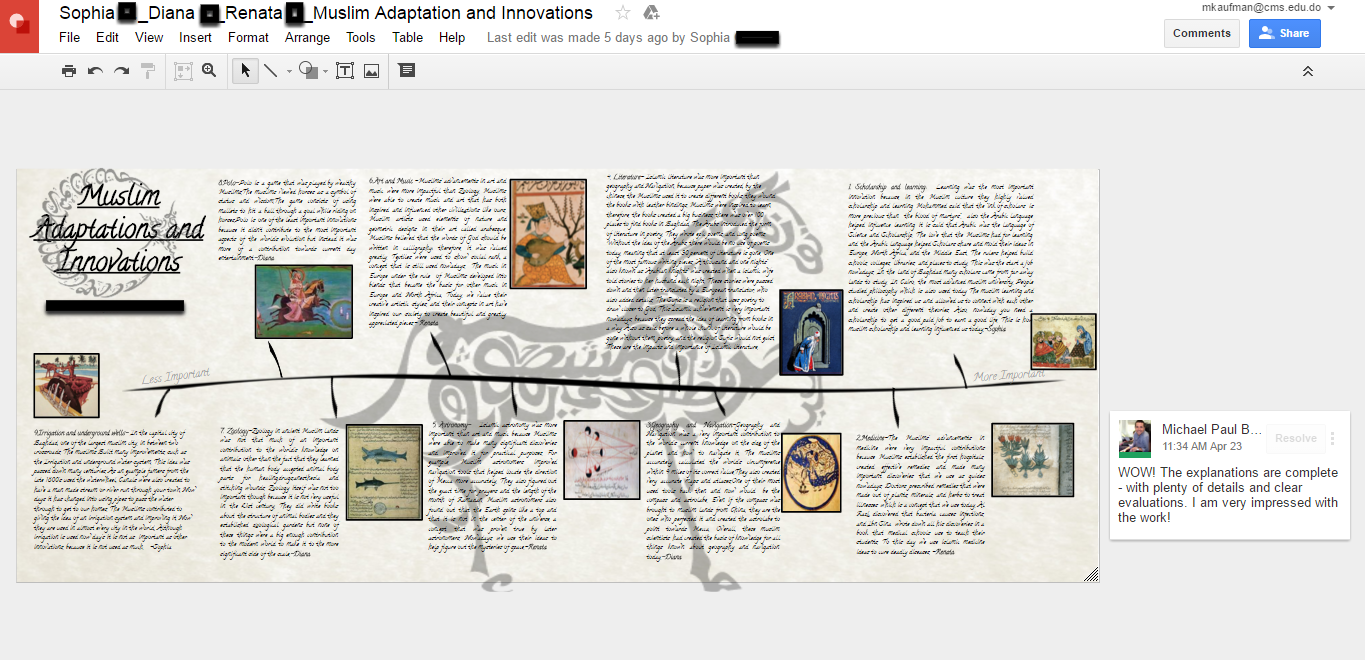
Google Drawings allows students to collaborate to make an evaluation line graph. An evaluation line graph is set up the same way as a timeline or other line graph, except that the different points of the line will represent the varying degrees of significance, or impact, as determined by conclusion of the evaluation. The graph acts not only as a visual presentation of student ideas, but also a way to get them to think deeper as they order each item or idea they are evaluating. I push students to be purposeful when placing the items on the line and where they land in comparison to the other items being evaluated. I also have students include a short write-up explaining their evaluations and where they are plotted on the significance line. Here is a detailed write up of a lesson where students have to evaluate the significance of Muslim innovations in the Middle Ages.
Apply to Other Subjects: try this same idea in language arts and have your students evaluate strong verbs or in science class to evaluate the impact of various scientific discoveries.
Reliability T – Chart
Have students determine the reliability of various sources and then have them sort it on a Google Drawings T-Chart. I used this as an introduction to evaluating articles for a current events lesson. I pre-created the Google Drawing with several articles already linked in. I then shared the Drawing and had students work in partners to go through the steps to evaluating sources. The nice part of using Google Drawings is the ability to quickly see where students placed each article to check for understanding. While the work of evaluating could have been done just in a Google Doc or other word processing program, the visual component brings more life to the lesson by having students visually demonstrate their outcome.
Apply to Other Subjects: have your science students evaluate the outcomes of different experiments to evaluate the validity of the conclusion or in language arts to practice making good predictions in reading by determining the reliability pre-made predictions.
Significance Sort
 Social studies and history are based on determining the significance of people and events. Who gets written about and who doesn’t? Which events do we cover and which ones gets skipped? I try to offer my students the opportunity to be historians by evaluating the significance of past people and events. One way is to give students a list of historical figures of a time period and ask them to sort them as very significant, significant, and less significant. You can do this as a quick-sort activity that students can share as a way to start a class discussion. Or have students go deeper and explain why – and then add their explanations to their Drawing. I do the former as “Do Now” for a lesson on the important people of the Renaissance. It’s great to hear the students debate and argue over who goes where!
Apply to Other Subjects: have students in math class evaluate and sort estimations as over/under estimates or in language arts evaluate and sort story characters based on characteristics you are studying.
How can you use Google Drawings to evaluate in your class? Please share your ideas below.
